| MATLAB Functions | Help Desk |
colorbar
Display colorbar showing the color scalecolorbar
colorbar('vert')
colorbar('horiz')
colorbar(h)
h = colorbar(...)
The colorbar function displays the current colormap in the current Figure and resizes the current Axes to accommodate the colorbar.
colorbar
updates the most recently created colorbar, or when the current Axes does not have a colorbar, colorbar adds a new vertical colorbar.
colorbar('vert')
adds a vertical colorbar to the current Axes.
colorbar('horiz')
adds a horizontal colorbar to the current Axes.
colorbar(h)
places a colorbar in the Axes identified by h. The colorbar is horizontal if the width of the Axes is greater than its height, as determined by the Axes Position property.
h = colorbar(...)
returns a handle to the colorbar, which is an Axes graphics object.
colorbar works with two-dimensional and three-dimensional plots.
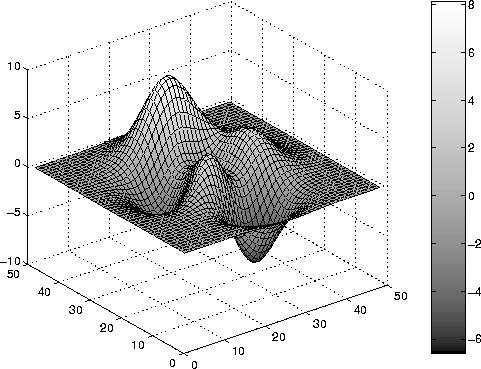
Display a colorbar beside the Axes:
surf(peaks);
colorbar

colormap