datetick
Purpose
Label tick lines using dates
Syntax
datetick(tickaxis)
datetick(tickaxis,dateform)
Description
datetick(tickaxis)
labels the tick lines of an axis using dates, replacing the default numeric labels. tickaxis is the string 'x', 'y', or 'z'. The default is 'x'. datetick selects a label format based on the minimum and maximum limits of the specified axis.
datetick(tickaxis,dateform)
formats the labels according to the integer dateform (see table). To produce correct results, the data for the specified axis must be serial date numbers (as produced by datenum).
Dateform
Format
Example
0
| day-month-year hour:minute
| 01-Mar-1995 03:45
|
1
| day-month-year
| 01-Mar-1995
|
2
| month/day/year
| 03/01/95
|
3
| month, three letters
| Mar
|
4
| month, single letter
| M
|
5
| month, numeral
| 3
|
6
| month/day
| 03/01
|
7
| day of month
| 1
|
8
| day of week, three letters
| Wed
|
9
| day of week, single letter
| W
|
10
| year, four digit
| 1995
|
11
| year, two digit
| 95
|
12
| month year
| Mar95
|
13
| hour:minute:second
| 15:45:17
|
14
| hour:minute:second AM or PM
| 03:45:17
|
15
| hour:minute
| 15:45
|
16
| hour:minute AM or PM
| 03:45 PM
|
| | |
|---|
Remarks
datetick calls datestr to convert date numbers to date strings.
To change the tick spacing and locations, set the appropriate Axes property (i.e., XTick, YTick, or ZTick) before calling datetick.
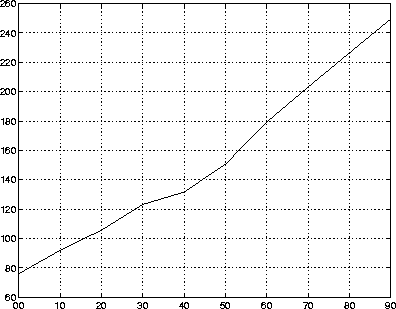
Example
Consider graphing population data based on the 1990 U.S. census:
t = (1900:10:1990)';     % Time interval
p = [75.995 91.972 105.711 123.203 131.669 ...
    150.697 179.323 203.212 226.505 249.633]';  % Population
plot(datenum(t,1,1),p)   % Convert years to date numbers and plot
datetick('x',11)     % Replace x-axis ticks with 2-digit year
labels
See Also
The Axes properties XTick, YTick, and ZTick.
The datenum and datestr functions in the MATLAB Language Reference Guide.
[ Previous | Help Desk | Next ]