lot3(sin(t),cos(t),t)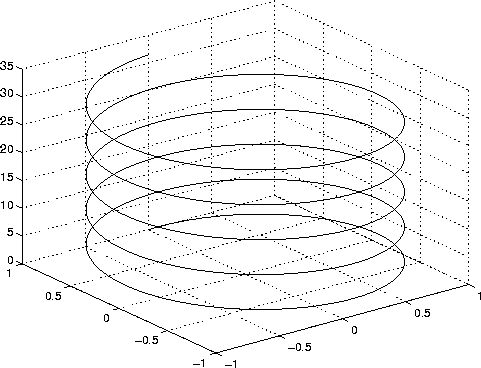
| MATLAB Functions | Help Desk |
plot3
Linear 3-D plotplot3(X1,Y1,Z1,...) plot3(X1,Y1,Z1,TheLineSpec,...) plot3(...,'PropertyName',PropertyValue,...) h = plot3(...)
plot3 function displays a three-dimensional plot of a set of data points.
plot3(X1,Y1,Z1,...),
where X1, Y1, Z1 are vectors or matrices, plots one or more lines in three-dimensional space through the points whose coordinates are the elements of X1, Y1, and Z1.
plot3(X1,Y1,Z1,LineSpec,...)
creates and displays all lines defined by the Xn,Yn,Zn,LineSpec quads, where LineSpec is a line specification that determines line style, marker symbol, and color of the plotted lines.
plot3(...,'PropertyName',PropertyValue,...)
sets properties to the specified property values for all Line graphics objects created by plot3.
plot3(...,'PropertyName',PropertyValue,...)
sets properties to the specified property values for all Line graphics objects created by plot3.
h = plot3(...)
returns a column vector of handles to Line graphics objects, with one handle per Line.
If one or more of X1, Y1, Z1 is a vector, the vectors are plotted versus the rows or columns of the matrix, depending if the vectors' length equals the number of rows or the number of columns.
You can mix Xn,Yn,Zn triples with Xn,Yn,Zn,LineSpec quads, for example,
plot3(X1,Y1,Z1,X2,Y2,Z2,LineSpec,X3,Y3,Z3)
Plot a three-dimensional helix:
t = 0:pi/50:10*pi;
plot3(sin(t),cos(t),t)
axis, grid, line, LineSpec, loglog, semilogx, semilogy