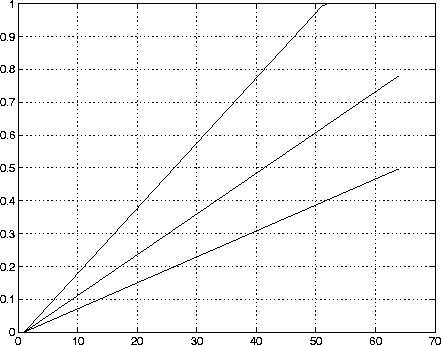
rgbplot(copper) 
| MATLAB Functions | Help Desk |
rgbplot
Plot colormaprgbplot(cmap)
rgbplot(cmap)
plots the three columns of cmap, where cmap is an m-by-3 colormap matrix. rgbplot draws the first column in red, the second in green, and the third in blue.
Plot the RGB values of the copper colormap:
rgbplot(copper)

colormap