Funded projects
|
|
 |
|
|
 |

Simulation of the reception, picking and expedition of ALMIRALL labs of Sant Andreu de la Barca (Barcelona)
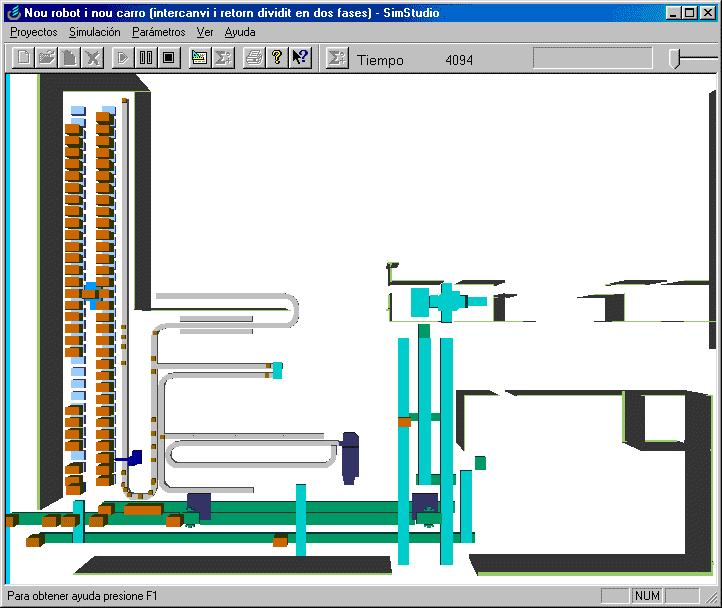
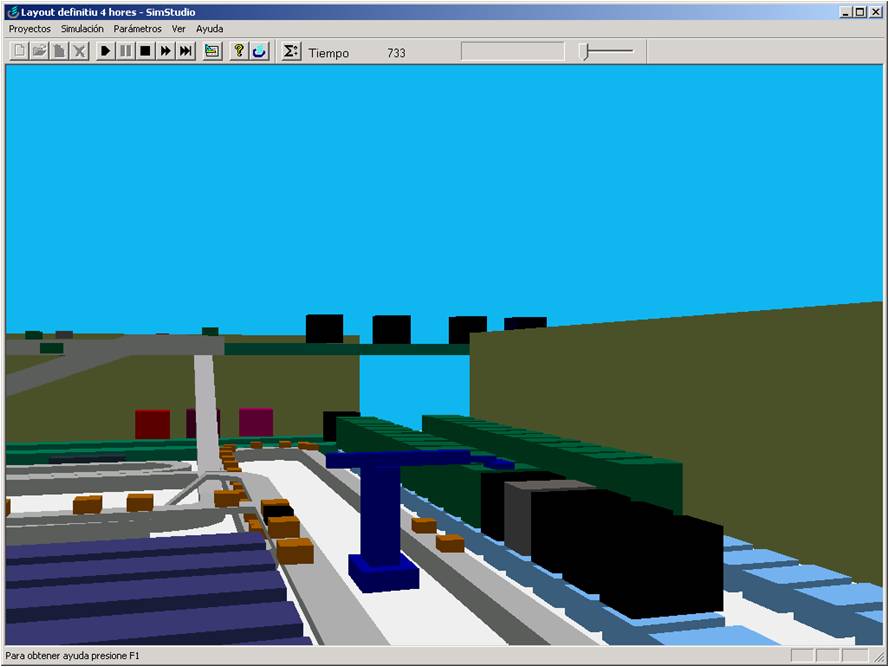
The main objective of this project was to help in the design of a new plant for the reception, expedition and picking of the ALMIRALL labs in Sant Andreu de la Barca (Barcelona). The model must allow the analysis of different configurations. The figure represents the virtual reality representation of the plant shown in the model.
 |
 |
 |
Internet reference:
http://zeisel.upc.es/logisim/Logisim.asp?anar=portafoli&item=produccio&subitem=3
ETFA 1999
http://ieeexplore.ieee.org/xpl/RecentCon.jsp?punumber=6597 18-21th Octoberl 1999, Barcelona, Spain. |
 |
ETFA09 Presentation
Simulation of reception, expedition and picking areas of a pharmaceutical products plant.
Authors: Josep Casanovas García Wilfredo Pérez Rivero Jordi Montero García Pau Fonseca Casas
Introduction
Detailed simulation model of some main processes in a pharmaceutical products plant involved in deep structural changes due to the merge of different new company activities. s Using an Object Oriented Simulation methodology called LeanSim, specially designed to create models for manufacturing and logistics systems.
s
Situation
Order’s expedition is partially automated. s Storage of complete production is organized for their later distribution. s Merge of several company units. s Increase in throughput is required and bottlenecks problems are expected for intermediate and terminated product.
s
Planned modifications
Robot carrying out picking of complete boxes. s Evaluate cost and potential use of automatic dispensers for the picking of product fractions. s New politics of orders preparation s Increase in production levels
s
Expected performance
Maintain current quality and due time, evaluating alternative shift policies to reach 24 maximum hours to customer service. s Production cost and picking of fractions should be reduced. s Alternatives comparison and possible decisions.
s
Project structure (I)
Analyze month type demand s Plant capacity analysis s References assignments to each picking types. s Use of automatic dispensers, necessary channels and approaches for the dynamic channels recharges.
s
Project structure (II)
Optimal size for pallets expeditionreception area. s Re-palettition unit dimension and associated processes. s Packaging analysis with the objective of diminish picking of units. s Determine scenarios and more interesting alternatives scenarios and simulate them.
s
Development phases
Macroscopic specification and modeling. Only considering main plant objects. s Microscopic model with highest level of detail in machines, conveyors, resources and other elements.
s
Software technologies (I)
s
Object Oriented
• • • • • Quick development Quality increased Easier maintenance Code and user interface reusability Risk reduction in development of very complex systems
Software technologies (II)
s
Component based modeling (COM)
• Binary standard for component interconnection • Programming language independence • Implemented in multiple platforms • Allows robust evolution of applications and systems based on components • Communication among components, in different processes or in networks
Leansim methodology (I)
Identify objects s Define state list and draw a finite state machine diagram for each object s Define channels to communicate objects each others s Define an external event list for each object s Define a SDL flowchart, peer to peer
s
Leansim methodology (II)
s
SDL State’s diagram (“Reposició” Object)
Leansim methodology (III)
s
SDL State IDLE (“Reposició” Object)
Leansim methodology (IV)
s
SDL State service (“Reposició” Object)
Visual Representation (I)
Virtual reality simulation environment. s User can observe the system modeled in the simulation like a replica of the real system. s Easier model validation increasing overall process credibility from final user point of view s Ability to become a powerful operators training tool.
s
Visual Representation (II)
Small errors or inconsistencies debugging during the specification and better understanding of the model. s Shows a nearest representation of the real image of the studied system. s Interactive representation integrated during model execution.
s
Model parameters
Visual representation (I)
Visual representation (II)
Visual representation (III)
Visual representation (IV)
Simulation results
Results (I)
Bottlenecks in each of the scenarios s Saturation of the simulation objects and consequently of the real objects (robot, robot assistant car, picking station) in the final layout s Shift organization with different levels of saturation. Operations synchronization.
s
Results (II)
Other performance measures. Equipment speed calibration and adjustment. Not served shipments,… s Robot design, banks, extraction strategies evaluation (extraction priority for star-class references, extraction priority for pallets, re-sending references to the robotized silo,…)
s
Demo

Video Almirall
This video shows the Almirall - Prodesfarma model.
|
This video shows the execution of the Almirall - Prodesfarma model. The model was developed using SDL formal languaje, implemented with C++ using Direct X. |
Optimization of the medicine clinical trials using intensive simulation
Analyze the possibilities of simulation use in the process related to the design of clinical trials, with the objective of reduce the time needed for evaluate new pharmaceutical products.
Publications related.
ASM 2005
http://www.iasted.org/conferences/pastinfo-469.html June 15 – 17, 2005 Benalmadena, (Spain) |
|
Clinical trials video
This video shows the Clinical trial simulation model.
|
This video shows the execution of the Clinical trial simulation model. The model was implemented using LeanSim system. |
ASM 2005 Presentation
FACULTAT D’INFORMÀTICA DE BARCELONA
CLINICAL TRIAL SIMULATION WITH LEANSIM
Pau Fonseca i Casas Ismail Abbas Josep Casanovas LCFIB UPC
Clinical Trials
FACULTAT D’INFORMÀTICA DE BARCELONA
Expensive experiments. l Need long time until achievement of acceptable results. l Consider small or large sample size.
l
n n
This sample size many times is so small. Many clinical trials may fail to achieve their expected results. Also, errors committed at the time of the design, such as, wrong endpoint selection, can also leads to misestimate the sample size.
Clinical Trials models
FACULTAT D’INFORMÀTICA DE BARCELONA
l
Model construction is based on describing the process of the clinical trial to:
n
n
n
Evaluate the behavior of the model under different hypothetical parameters changes. To analyze the evolution of the selected respond parameter (in our case level of viral load in HIV patients) during the follow-up visits under the effect of both treatments. To evaluate the behaviour of the variables under study, from the initialization of the follow-up period of the trial until the evaluation of the last patient.
Clinical Trials conceptual model
Patient
FACULTAT D’INFORMÀTICA DE BARCELONA
Arrivals centers
1 2 3 4
/
New patient New center
5
Selection Inclusion exclusion /
Recruitment, inclusion, follow-up and economical sub-models of clinical trials
Treatment
Control treatment / new
1
2
3
4
5
Follow Statistical model Clinical model
- up
Terminal state End of trial Withdrawals Other causes
Epidemiological model
Economic model
Simulation of clinical trials
FACULTAT D’INFORMÀTICA DE BARCELONA
Cost design: Inclusion, follow-up Cost opportunity
Cost Sub-model
Recruitment sub-model
Inclusion sub-model
Follow-up sub-model
Total duration Total cost Statistical significance Power
Number of centres Arrivals/inclusion rates
Clinical-statistical model, epidemiologic model efficacy, sample size, test statistic, endpoints
LeanSim environment
FACULTAT D’INFORMÀTICA DE BARCELONA
l l
Event Scheduling simulation environment Have different elements:
n n
n n
LeanEditor, model’s edition tool. LeanGen implements event scheduling simulation engine. The engine owns its set of events enabling communications, via TCP/IP, with other simulation components. Lean Client shows model virtual representation. LeanStatistics allows data acquisition from a LeanSim model and shows the statistics in execution time.
FACULTAT D’INFORMÀTICA DE BARCELONA
LeanStatistics
LeanSim Clinical Trial construction
FACULTAT D’INFORMÀTICA DE BARCELONA
Patient inclusion
Visit N
No Is the last visit?
Yes Results
Model implementation
FACULTAT D’INFORMÀTICA DE BARCELONA
******************************************* ************* PROCESS.SCN **************** *** Fitxer de configuració de processos i entitats *** ******************************************* [ENTITATS] ENTITAT1=pacient [pacient:ATRIBUTS] FITXER=pacient.txt ATRIB1=Orientacion ATRIB2=Icon2D ATRIB3=Forma ATRIB4=Color ATRIB5=Escala [pacient] Orientacion_Info=6,Orientacion,0 Orientacion=0|0|0 Icon2D_Info=1,Icon2D,0 Icon2D=default.ico Forma_Info=2,Forma,0 Forma=Inici.wrl Color_Info=6,Color,0 Color=1|1|1 Escala_Info=6,Escala,0 Escala=1|1|1 [pacient:assaig] ACTION1=g(1),generar,12|Inclusio.vbs,NO,NO,pacient:assaig|0,1,pacient,12|Pacients.vbs; ACTION2=centre hospitalari(1),iterar,1|1|0.000000,NO,NO,; ACTION3=espera(1),esperar,12|TempsEspera.vbs,no,NO,; ACTION4=espera(1),goto,1|1|0,NO,NO,100|pacient:assaig|2; [pacient:final] ACTION1=final(1),destruir,1|1|1,No,NO,; [PROCESSOS] PROC1=pacient:final PROC2=pacient:assaig
Visual Basic modules
FACULTAT D’INFORMÀTICA DE BARCELONA
l
The visual basic script files that rule the model are:
n n n n
n
n
Condicio.vbs: Determines if patient finishes the experiment. Inclusio.vbs: Time between generations. TempsEspera.vbs: Time between two visits. Inicialitzacio.vbs: Contains initialization procedures for each patient. Iteracion.vbs: Determines operations done in each iteration (visit) in the center. Pacients.vbs: Determines the numbers of patients involved in the experiment.
l
Condicio.vbs is:
n
CurrentEntity.GetAttributeValue("visita") < 7
Inicialitzacio.vbs code
FACULTAT D’INFORMÀTICA DE BARCELONA
Dim b Dim edat Dim pes Dim sexe b = Simulator.GetUniform(0, 1) If (b < 0.72) then 'Men sexe = 0 CurrentEntity.SetAttributeValue "sexe", 0 (...) else 'Women sexe = 1 CurrentEntity.SetAttributeValue "sexe", 1 (...) end if (...) if (sexe = 0) then CurrentEntity.SetAttributeString "forma", "HomeBlau.wrl" else CurrentEntity.SetAttributeString "forma", "DonaBlau.wrl" end if else CurrentEntity.SetAttributeValue "tractament", 1 if (sexe = 0) then CurrentEntity.SetAttributeString "forma", "Home.wrl" else CurrentEntity.SetAttributeString "forma", "Dona.wrl" end if end if
FACULTAT D’INFORMÀTICA DE BARCELONA
Clinical trial LeanSim model
FACULTAT D’INFORMÀTICA DE BARCELONA
Results
FACULTAT D’INFORMÀTICA DE BARCELONA
Results
Conclusions
FACULTAT D’INFORMÀTICA DE BARCELONA
l Clinical
trials are always a large process that involves a lot of people and resources in a long period of time. l Duration of clinical trial determines cost and due to patients abandonment problem sometimes clinical trial is not valid. l Is difficult to compare different alternatives in order to determine what is the best approach.
Conclusions
FACULTAT D’INFORMÀTICA DE BARCELONA
l l
l
In this work a new clinical trials simulator is presented. Reproduction of clinical trial through simulation enables the possibility of determine if initial number of patients are enough for clinical trial typology, and compare different design alternatives. For pharmaceutical industry this tool can reduce clinical trial cost related to the launch of a new medicament, and for society the use of this tool represents faster use of new medical treatments.
Questions?
FACULTAT D’INFORMÀTICA DE BARCELONA
l l l l
Pau Fonseca i Casas
n
pau@fib.upc.edu esmail@fib.upc.edu josepk@fib.upc.edu
Ismail Abbas
n
Josep Casanovas
n
C/ Jordi Girona, 1-3 08034 Barcelona Phone:+34 93 401 70 00
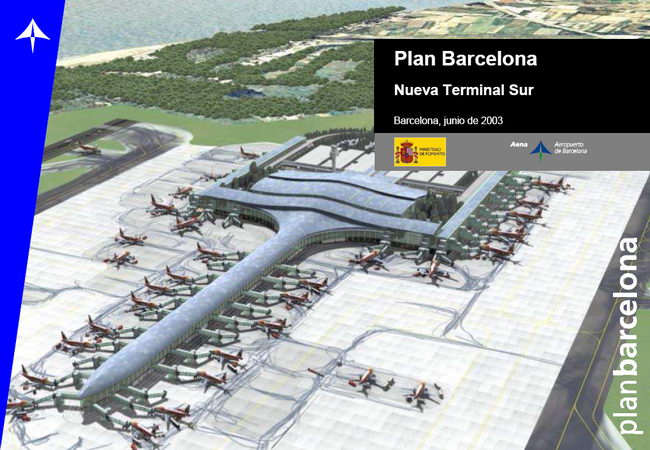
Simulation of the NAT (Nova Àrea Terminal) of the Barcelona International Airport
The airport management is hard job because a lot of flows converge in different terminal spaces. Each of this flows have its own personality and characteristics, and of course is necessary to know the structure and quantity of each of them in order to manage the different airport spaces, and try to avoid bottlenecks. Spaces requirements calculus, in an airport, are based typically in differential equations, or queuing theory. These approximations however, are not the better solution if we want a precise approach to the reality, or if we need a model that can be defined with a lot of different parameters. Our project are based in the necessity of know the different new Barcelona Airport international terminal bottle necks, before its real construction. This goal determines the simulation model construction necessity. The simulation model was developed, closer to the reality, in order to return the most realistic data about the possible collapse of certain critical areas of the NAT. Check in, tickets exposure, baggage carrousel, and many others limited resources determine the quality level of an airport, and in a complete new design is very difficult know the appropriate dimension of each area, obviously because is difficult to predict the behaviour of the different flows, (for instance the passengers flows).
Internet reference:
http://logisim.fib.upc.es/logisim/public/jsp/web/1_3_3_1.jsp
Video NAT
This video shows the NAT model.
|
This video shows the execution of some of the areas represented in the model. The model was defined using SDL languaje and implemented using Witness 2003. |
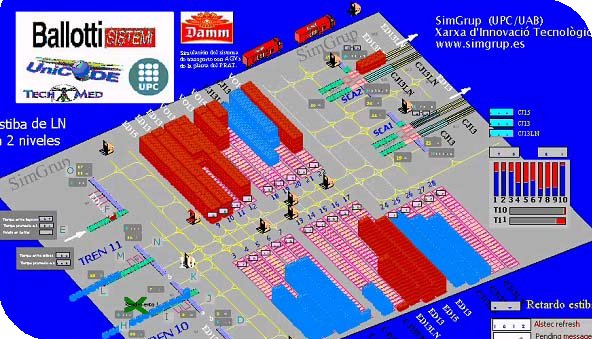
Simulation of the AGV's control system of a DAMM production plant in el Prat
The main objective of this project is to perform a simulation of the AGV’s of the industry and its environment in order to evaluate the current management and planning algorithms. Also the test and the validation of the communication protocols between the different agents involved in the transport of the industry and the analysis of the behavior of the system in front of different situations, are other objectives of the project.
Video DAMM
This video shows the DAMM model.
|
This video shows the execution of the DAMM model. The model was defined using Petri Nets and implemented using Arena. |
Distributed Algorithms and Software for Vehicle Routing Optimization in Small and Medium Enterprises
Enterprises in the road transportation sector have to face several difficult challenges. Namely, they have to design distribution strategies and policies which combine economic efficiency with sustainability criteria. This issue is critical, especially for small and medium enterprises (SME), since they hardly have the economic and human resources necessary to implement and manage the complex mathematical methods associated with routing optimization -i.e. metaheuristics, mathematical programming methods, and so on. Similarly, current computing technologies -such as commercial software licenses or cluster infrastructures-, are not always affordable to most of these companies. However, it is obvious that these methods and technologies could help them to significantly improve their productivity levels by reducing costs and by making their business model more competitive and sustainable. Thus, the ultimate mission of this project proposal is to offer efficient solutions to the aforementioned challenges. To this end, we propose the development of methodologies, optimization algorithms and open source software -and therefore software affordable to most SMEs- which can be used by companies in the transportation sector to develop efficient, sustainable and environment-friendly delivering strategies. These solutions are expected to be particularly useful in realistic scenarios characterised by different levels of uncertainty -e.g. customers with stochastic demands, random behaviors associated with transportation and service times, etc. The introduction of environmental criteria in the decision making process implies the consideration of traditional costs (i.e. petrol consumption or workers’ salaries, for instance) along with other costs related to environmental factors (e.g. acoustic and air pollution) according to the legal regulations that are in force in Europe and Spain. The authors of this proposal consider that this mission, even being ambitious, can be achieved by the research teams supporting the proposal. These teams constitute an interdisciplinary group with long experience in similar shared projects. The following arguments reinforce the idea that this mission can be accomplished by the members of this group:
- They accumulate a long expertise on the Vehicle Routing Problem, its newest and most advanced variants and the best known algorithms and methods (both complete and incomplete). In fact, some of these methods have been developed by researchers of this group and published in international journals, books and conferences.
- They are aware of suitable techniques and procedures to perform the environmental costs measurement in the road transportation. Some of these techniques have been developed by researchers of these teams in previous research projects funded by the Spanish Ministry of Innovation and other national and international institutions.
- They hold the know-how associated with the development of the distributed software which allows sharing computing resources among different machines.
- Some of the members of the research group show experience in the use of mobile communication systems and geographic information systems (GIS), which can be necessary to perform monitoring processes of the transportation tasks, along with "real-time" routing re-design whenever unexpected events take place -e.g. heavy traffic, demand variations, accidents, and so on.
- They are in touch with several companies in the transportation sector and consultancies which have shown interest in actively contributing to the project development and, thus, benefit from their methodological and technological outputs.
Therefore, each research team has an assigned target to fulfil, being the global mission of this project the result of the coordination of the following sub-missions: (a) the team from the Public University of Navarre (UPNA team), which includes researchers from the fields of Operations Research and Economics, will focus on the development of economic models to internalise environmental factors in the cost functions to be minimised; (b) the team from the Open University of Catalonia (UOC team), which includes researchers from the fields of Computer Engineering, Mathematics, and Management, will work in the adaptation of routing heuristic algorithms to solve realistic delivery problems; and (c) the team from the Autonomous University of Barcelona (UAB team), which includes researchers from the fields of System Engineering and Automatics, will develop the software and the mathematical models to solve the routing problems in an exact way -in those cases where this approach is suitable. According to the previous paragraph, the following main general objectives can be established:
- Diagnosis and statement of the main concerns, current needs and future challenges of road transportation, focusing on its economic and environmental impact.
- To develop modeling methodologies that allow for formal representation of different distribution and routing problems and to implement models able to represent realistic transportation scenarios.
- To develop and to implement flexible, efficient and robust algorithms in order to provide optimal or quasi-optimal solutions to realistic distribution and routing problems.
- To reduce the entry barrier to optimization technology by designing a computational infrastructure that enables enterprises to improve their distribution strategies and routing operation by using affordable software and hardware resources.
Finally, it is important to highlight that the teams that support this proposal are co-founders of the HAROSA Knowledge Community (http://dpcs.uoc.edu/joomla/index.php/about-harosa-kc). The HAROSA KC is a scientific international and interdisciplinary community composed by 10 research groups from Spain and 6 research groups from the rest of the world. The HAROSA mission is the development of "Hybrid Algorithms for solving Realistic rOuting, Scheduling and Availability problems". Being relevant members of the HAROSA Knowledge Community guarantees the international visibility of the proposal along with its viability, since it can be also supported with HAROSA funds already obtained in different competitive calls. Moreover, the research group owns a powerful computer cluster and some workstations equipped with state-of-the-art graphical process unit processors (GPUs), which have been provided by NVIDIA Inc. to support our research. Finally, it should be also noticed that the UOC team is member of the organization PanetLab (http://www.planet-lab.org/), and thus they can use its resources during the development and tests phases of the distributed system to be constructed.
Represent statistical information over the web.
The online application can be accesed here.
Robustness, recoverability and congestion in public transportation networks
The project is centered in metropolitan transportation, comprising bus networks, rapid transit networks and metro. For the case of bus networks, aspects regarding congestion and time varying demand will be specially taken into account.